
It’s difficult to comprehend the amount of data that Google processes every day. While you almost certainly rely on Google for getting information online, did you know that Google provides a tool that lets you analyze what other people search for?
This service is Google Trends, a free tool that you can use to get insight into what people look for online. Whether you do it just for fun or for a business advantage, here’s a quick guide to what Google Trends can do.
How to Search With Google Trends
Head to the Google Trends homepage first. To get started, enter a search term that you’d like to analyze in the box. As you do this, you’ll likely see some choices in the dropdown box below your term.
These are important because they let you choose what you want to look at more closely. As an example, let’s say you enter “Tokyo” in the search box. The box lets you choose between Tokyo as a search term and a topic.
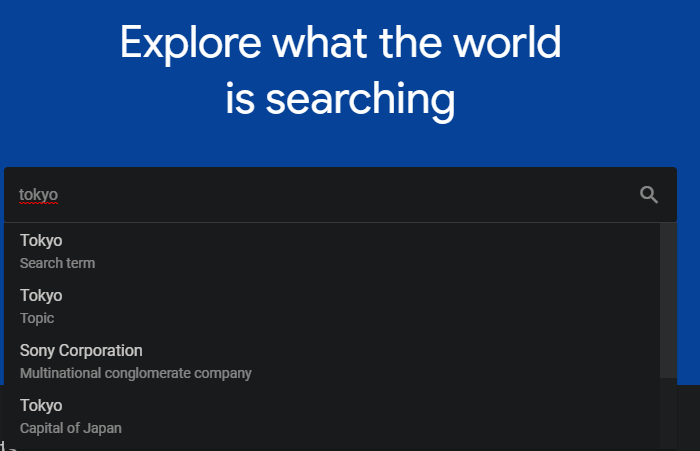
Search terms are more general and include matches for all words in your query in English. So for Tokyo as a search term, Trends would include queries like “Tokyo Drift” and “things to do in Tokyo”.
Meanwhile, a topic is a group of terms that shares meaning. If you select Tokyo as a topic, results would include searches for “capital of Japan” and “Tokio”, the Spanish word for Tokyo.
You can also use the suggestions to clarify terms with multiple meanings. For instance if you enter “Apple”, you can specify if you’re looking for the tech company or the fruit.
Analyzing Google Trends Results
Once you’ve searched for your term or topic, you’ll see a page with all kinds of information about it. By default, Trends will show information for the United States in the past 12 months. If you’d like to change this, use the dropdown boxes at the top of the page.
Here you can change countries (as well as choosing Worldwide), change the time period (Trends goes back to 2004), and specify a category or search type. Using that last option, instead of the default Web Search, you can see data for other Google services, like Google Images and YouTube.
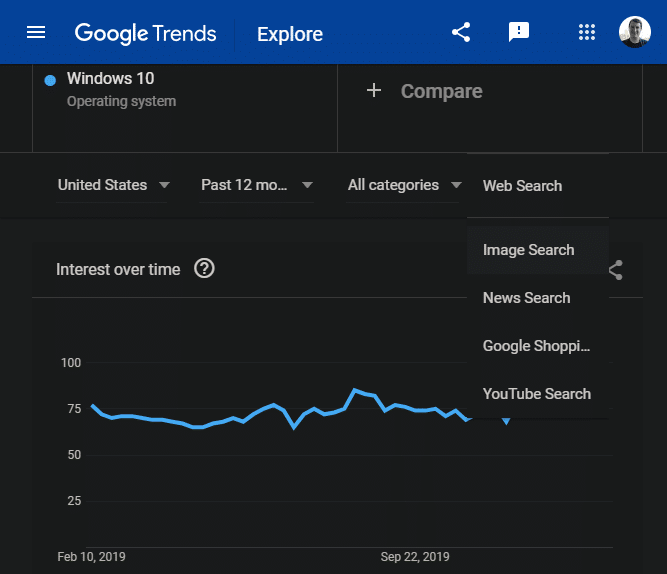
The Interest over time graph lets you see the relative interest for the term on a scale of 0-100. 100 signifies the most popular point in time for that term, meaning a time with a value of 50 was half as popular as the peak.
Taking an example, we can see that search interest for Windows 10 peaked around January 12-18. This makes sense, as January 14 was the end of life date for Windows 7. People were likely looking for Windows 7 alternatives at that time.
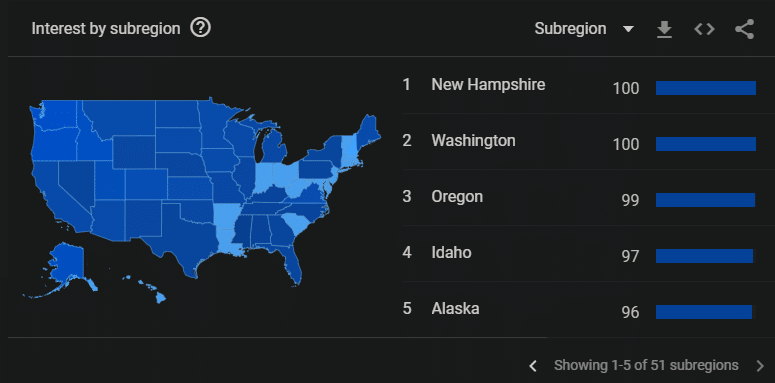
Continuing on, the Interest by subregion section shows the states where the term was most popular (for the United States). This will vary if you selected a different country or Worldwide at the top.
At the bottom of the trend page, you can review related topics and queries. This provides you with more information about what people interested in a certain topic search for.
Comparing Multiple Terms in Google Trends
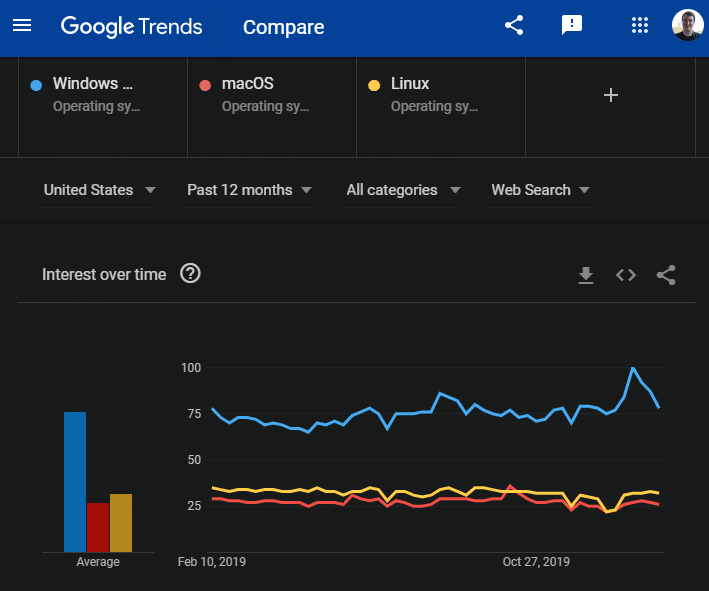
For deeper analysis, Google Trends lets you add additional queries (up to five total) at the top of the page. Click the Compare field and enter a new term to show data for it alongside your original search. Each term gets its own color.
After you add more terms, you’ll see additional data in the sections described earlier. Interest over time will plot each term on the graph and show you their average scores. The subregion section will show how the terms compare, as well as providing a separate section for each term so you can look at them individually.
If you want to really dive into data, mouse over an item at the top of the page, click the three-dot Menu button that appears, and choose Change filters. This lets you adjust the region and time period for each term individually.
Using this, you could, for example, compare global searches for iPhone in the United States over the past 10 years against interest in smartphones globally. The only limit is what you can think up to compare!
Learn More With Google Trends
Comparing terms on your own is a great use of Google Trends, but the service has more to offer. Click the three-line menu at the top-left to show more options on a sidebar.
Trending Searches lets you see what people are looking for today and the biggest searches of the past few days. Use Realtime Search Trends at the top of the page for even more recent data. You can also change the country if you like.
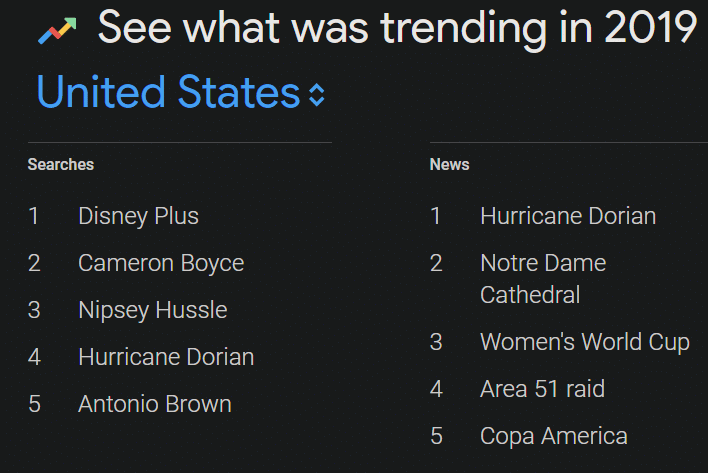
Choose Year in Search on the left side to get a glimpse at the biggest searches of each year in several categories, along with a special video Google creates. You can change countries using the text in the middle, or the year using the dropdown at the top-right.
Finally, select Subscriptions from the left sidebar, and you can set up email notifications about updates on certain terms. This lets you check in on how interest on something changes without opening Trends manually all the time.
Search Trends Are Fascinating
Now you know how to use Google Trends to analyze the massive amounts of data that pass through Google. It’s an interesting way to spend a few minutes, whether you want to get something actionable out of the data or not.
For more on the search giant, take a look at our explanation of how Google works.